The formula to compute Hemispheric Power (HP) and the Hemispheric Power Index (HPI) was devised by Dave Evans, NOAA/SEC. (see Reference 1.) The HP is an estimate the energy of ALL electrons precipitating into a hemisphere. The estimate is obtained by comparing the energy flux (ergs/cm^2) observed along an orbital track of a NOAA/TIROS spacecraft with the climatology maps of the energy flux developed from the NOAA/TIROS data base. The maps were based on 10 levels of geomagnetic activity which roughly correspond to the planetary magnetic index going from 0+ to 5+. The profile and magnitude of the energy flux of precipitating electrons observed along an orbital track is matched to one of the 10 maps. The HPI is simply the number of the map selected. The HP is
=<Phi> * A(l) * f(M.L.T)
where
The HP published by NOAA/SEC is
We have obtained Evans' formula, and we now have computed the HP from data obtained from the electron spectrometers (SSJ4) on DMSP spacecraft. The HP values from 1982 to "yesterday" are available as text files from K. Martin. The values from the past 4 days are available in graphic form on our Web page showing recent DMSP data. "Yesterday" refers to that fact that data from the previous U.T. day has been received, processed and posted each day by 10 a.m. Eastern Time (GMT-5 hours).
After implementing Evans' code, the question arose, "Do the HP's calculated by NOAA/SEC from the particle spectrometers on NOAA spacecraft match the HP's which we calculate from the SSJ4's on DMSP spacecraft?" The first purpose of the question is to determine that we have implemented the Evans algorithm properly. The second purpose is to determine if there are any fundamental instrumentation or geophysical reasons for any differences. What we found was that when the values are averaged, the NOAA and DMSP HP values match quite well. However, we examine near simultaneous observations, the match between the NOAA and DMSP HP values is fair to poor.
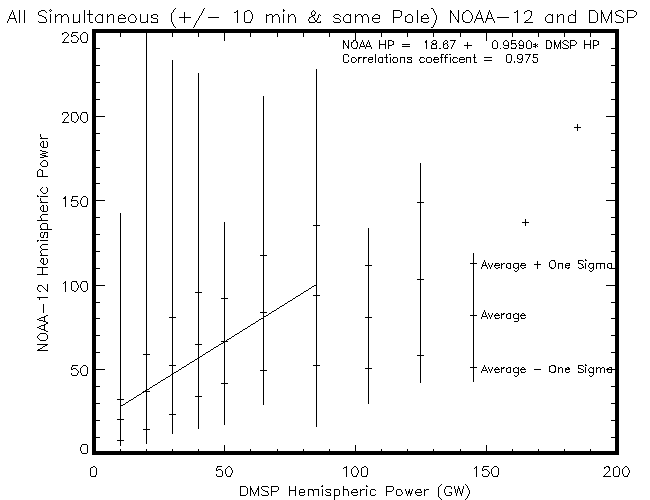
GOOD MATCH: The figure below shows the correlation of the NOAA and DMSP data after binning. In order to create the plot, we binned the DMSP F11 and F13 HP values into groups 10 gigawatts (GW) wide from 5 GW to 55 GW and 20 GW wide from 55 GW to 155 GW. The bars show the range of simultaneous NOAA-12 HP values within each bin. The tick marks indicate the mean and 1 sigma values. The data used for this plot were considered simultaneous only if the DMSP and NOAA spacecraft reached the maximum latitude within 10 minutes of each other and were in the same hemisphere. A linear correlation between the mean DMSP and NOA values from 5 to 95 GW shows an excellent correlation of the means. The correlation was stopped at 95 GW becuase the original hemisphere power patterns only were validated up to 100 GW. The NOAA-12 data were chosen becuase it has the best of the recently acquired NOAA data (priv. comm. from Dave Evans) The DMSP F11 and F13 data chosen becuase their orbits planes where closer to the orbit plane of NOAA-12 than F12 and F14.

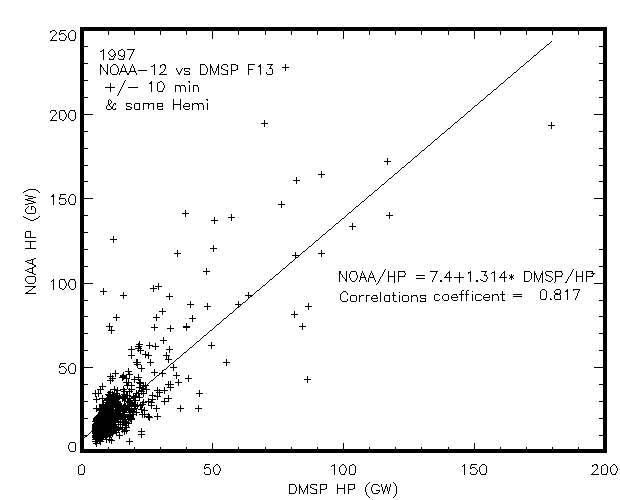
FAIR TO POOR MATCH: The figure below shows a "scatter plot" of the NOAA-12 (local time at the equator ~18.5 hours) and DMSP F13 (local time at equator ~17.5 hours) data for one year. Each point shows the HP obtained simultaneously (+/- 10 minutes) from the two spacecraft. Any value of HP from NOAA-12 or DMSP F13 which was less than 5 GW is not used becuase it is just as likely to indicate that a pass which did not cut through the full auroral zone as to indicate a very low level of activity. A linear regression was done with all the data shown. The line shown is the result of the regression analysis. The resulting correlation coefficient of 0.817 indicate a reasonably good correlation between the two data sets.

If the window for simultaneous data were open up to be +/- 20 minutes or if the NOAA-12 data were to be correlated with DMSP F12/F14 data (local time at equator ~21 hours), then the correlation coefficient would be 0.5 or less. This is poor correlation between the 2 data sets. This is a problem becuase the HP values are often used to computer models of the ionosphere, thermosphere, and magnetosphere to indicate the level of activity of the whole system for up to 3 hours.
SOURCES OF VARIABILITY OF HP: The calculated hemisphere power varies on a time scale of minutes and a spatial scale for the following reasons:
A BETTER GEOMAGNETIC ACTIVITY INDICATOR(?): For applications which need a parameter which tends to be better at describing the global environment and slower to change, it might be better to use the Midnight Boundary Index (MBI) parameter than the HP parameter. The MBI is the equatorward edge of auroral electron at the midnight meridian. It tends to describe activity in the whole inner magnetosphere region while the HP may be more influenced by local variations in the activity in the inner magnetosphere and by activity in the outer magnetosphere and boundary layer. A model of the thermosphere is one example of an application for which the MBI might be better than HP. During periods of high geomagnetic acitivity, the thermosphere acquires energy from the ionosphere and does not come into quasi-equilibrium with the ionosphere for a period of hours. On the other hand, the HP might be a better indicator is the application is focused on the outer magnetosphere.
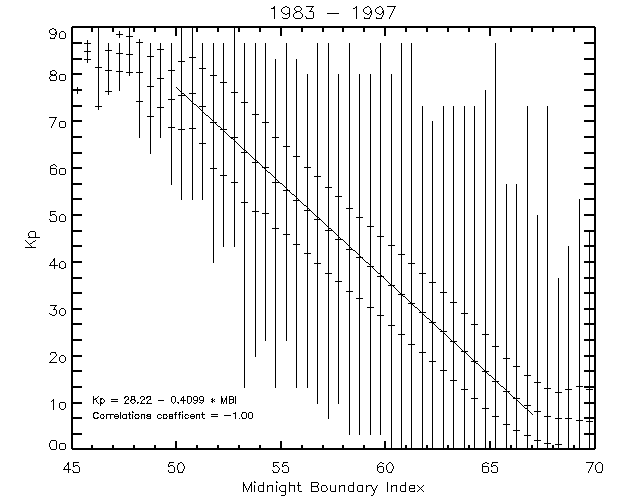
As shown in the figure below, the MBI is a good proxy for the planetary magnetic activity index, Kp . The figure summarizes all the MBI values from 1983 to 1997. The tick marks indicate the mean values of Kp at each 0.5 degree bin of MBI and 1 sigma deviations from the mean values. The vertical bars show the extremes within each bin. A linear regression was done between the mean MBI vs Kp points from low to moderately high levels of activity. The very highest values of MBI (very low activity) were not fitted because these are probably times of a strong northward component of the interplanetary magnetic field (IMF) and these times have previously been shown to have an activity pattern that does not fit the activity pattern of IMF Bz ~ 0 or southward. The very lowest values of MBI (very high activity) were not fitted because it has already been shown that major storms tend to yield non-linear responses in MBI and other geophysical parameters.

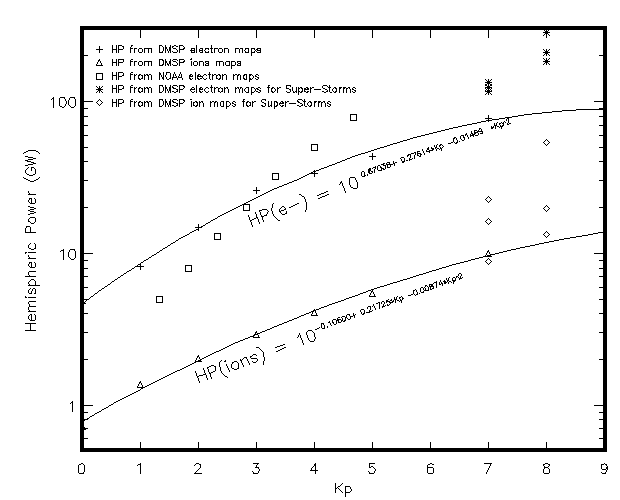
The following plot is based on a previous survey of the DMSP data( Bell et al., 1997; Brautigam et al., 1991). It shows that there is a good, but non-linear correlation between Kp and the Hemispheric Power calculated from climatology maps of DMSP precipitating electron data. The relationship obtained by Evans from his climatology of NOAA precipitating electron data is also shown and is clearly different.

CAN THE ESTIMATE OF HP BE IMPROVED?: There are several possibilities for improving the HP parameter:
REFERENCES:
Go to DMSP Home Page