Frequently Asked Question About the DMSP High Latitude Plots

1. What are the contents of the plots?
On the "High Latitude" page, there is a list of DMSP spacecraft for which data exists. Click on the spacecraft name and a page of "thumbnail" plots will appear. The "thumbnail" plots are almost unreadable, but they do give the viewer a sense of what is available. To see a full-size version of any one of the plots, click on the thumbnail. The first plot in any set of high latitude plots is a map of the world with the ground tracks of the DSMP spacecraft when data is available. Each of the following plots represents one high latitude pass of the selected spacecraft. The time of the start of the pass is printed on the thumbnail plots. Each plot is shows 30 minutes of data and is supposed to start near 45° corrected geomagnetic latitude, cover the entire high latitude portion of the orbit and end near 45° corrected geomagnetic on the other side of the plot. The first combined instrument plot of the day starts at 0000 U.T. and continues for 30 minutes regardless of latitude. The full-sized plots have the position of the spacecraft printed below the plot in corrected geomagnetic coordinate at 3 minute intervals. There are two type of plots: ones with only particle data, ion drift data and magnetic deflection data. The second type include all of the previously mentioned data plus the in-situ thermal ion density data.Click Here for an annotated example of the first type of plot.
2. Why are there 5 minutes data gaps over the Northern Hemisphere in many plots?
The DMSP spacecraft prior to F15 used several tape recorders. Typically only one recorder was operating at a time. Over a tracking station, one of the idle recorders was started just before the operating recorder was stopped and put into playback mode. After a spacecraft has been in space for several years, there may be only one usable recorder. If so, it cannot playback and record at the same time and data is lost during the playback period. F15 uses two solid state recorders and two tape recorders. F16 and beyond only use solid state recorders. With the expected long lifetime of the solid state recorders, this problem should not occur for F15 and beyond.
3. Which direction is the ionospheric plasma flowing when the H-component and V-Component of the Ion Drift Meter (IDM) is positive?
A positive H-component in the IDM data is always sunward and perpendicular to the direction of flight in the plots on this site. For F8, F11 and F13, V(horizontal) is roughly parallel to the 12 noon meridian; for F9, F10, F12, F14 and F15, V(horizontal) is roughly parallel to the 3 p.m. meridian. V(vertical) is always radially upward.
4. Which direction is the magnetic field deflection vector components indicated by Bx, By and Bz?
The SSM sensor's coordinate are: The +X component of the measured magnetic field is down along the local vertical direction. The +Y component of the measured field is perpendicular to +X and in the forward direction. Since the spacecraft's velocity vector is not exactly perpendicular to the local vertical direction at all time, there is a very small angle between the SSM +Y direction and the spacecraft's velocity vector. The +Z component of the measured field is perpendicular to +X and +Y in the sense of a right-handed coordinate system. Thus +Z is toward the night side of the orbit plane.
5. After finding a page of small plots of high latitude data, I click on one of small plots and I don't get same result every time. Why?
At first, all of the plots were made as "gif "files. Later they were made as "png" files. The "gif" plots can be shown in a browser without any accompanying html file. The "png" files need to be wrapped into an html file. Thus when you click on a page of small plots made with "gif" files, the browser is sent directly to a large version of that plot only which is also in "gif" format. When you click on a page of small plots made with "png" files, the browser is sent to a large version of that plot on an html page that contains all of the large "png" plots for that satellite-day. This single html page was created because it was easier to write than to write 30 html pages for one satellite-day of data. The switch from "gif" format to "png" format was made because IDL, which is used to create the plots, stopped supporting "gif" format.
6. What do the color codes on the particle spectograms mean?

Color bar for particle data in survey plots 
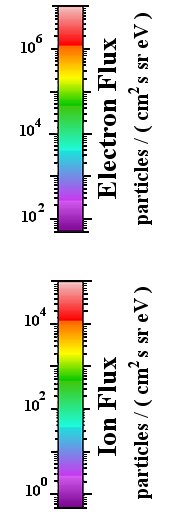
The SSJ spectograms are a representation of the differential number flux or particles per (square-centimeter second ster-radian electron-Volt). The survey plots DO NOT include a plot of differential ENERGY flux. The conversion from counts to differential number flux varies from spacecraft to spacecraft, but the conversion from differential number flux to color is the same for all spacecraft. If there is a noticeable difference between one spacecraft and another for the same day, it might be due to errors in the calibration. For example, the 30 eV to 1 keV ion channels on F15 do not work properly and so the reported low energy ion flux is much much less than it really is.

Since the number flux of electrons is much higher than the number flux of ions, there are separate flux-to-color conversion tables for the electrons and ions.

This color bar is similar but not the same as the color-to-flux table used in other applications.

Have a Question? Ask K. Martin.

Please read this Data Usage Notice

Go to DMSP Home Page